The opening tip of the 2020-21 NBA season is upon us, and we’re very excited to begin rolling out our NBA content offering. We will continue our regular NFL schedule, but will be focusing our new tool development time on the NBA side of things. With the season mere hours away, we wanted to put together an introductory post outlining the current ASA NBA toolkit, tools that are on the 2021 season roadmap, and other places around the industry where you can find our work.
Current NBA Tools - Available on ASA Site
Fastbreak Projections
This is our flagship projections system that comes equipped with a simple optimizer that allows you to build multiple lineups with numerous lineup, team, and player rules. Our projection system relies on a neural network algorithm that generates predictions based on internal minute and usage projections, as well as numerous player-specific, team-specific, and opponent-specific usage and efficiency metrics.
Team Pulse App
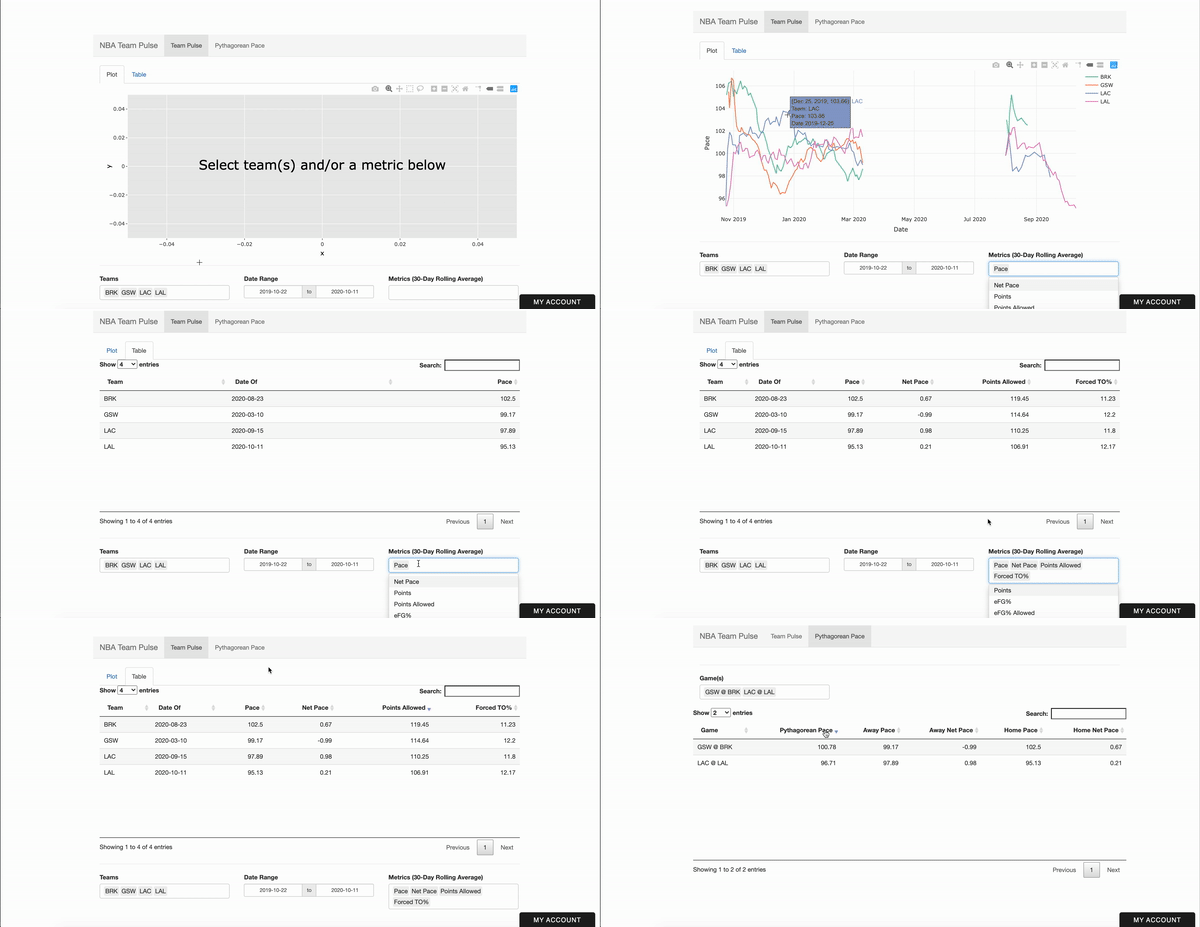
This is a new addition to our NBA toolkit. We want to make a concerted effort to look at game environments as a product of the team characteristics of both teams in a given game. The “Team Pulse” app is intended to allow users to evaluate teams (and therefor overall game environments) rather than focusing specifically on players. The “Team Pulse - Plot” tab outputs rolling team heuristics, to allow users to visualize team-level trends in pace, points allowed, offensive efficiency, and more. The “Team Pulse - Table” shows most recent rolling values of these metrics, allowing users to sort to identify which teams are the best (or worst) in specific team-level categories. The “Pythagorean Pace” tab is intended to allow users to identify possible high-pace game environments, which is one of the key traits we should be targeting, particularly when building game stacks for tournament lineups.
We calculate “Pythagorean Pace” of a game, between TeamA and TeamB as:
[(avg. pace TeamA) + (avg. pace TeamB) + mean((avg. pace TeamA + avg. NET pace TeamB), (avg. pace TeamB + avg. NET pace TeamA))]/3
Where “avg. NET pace” of a team is +/- number representing the relative rate that a team speeds up their opponent. That is, if Milwuakee plays 2 games, against Miami & Philadelphia who average paces of 99 & 96 respectively, and plays those two games at a 104 & 106 pace respectively, they have effectively sped up Miami & Philadelphia by 5 & 10 possessions, or an average net pace of +7.5.
Player Distributions App
One of our oldest applications, the player distributions app allows users to view players’ historic range of outcomes either on a per-game or per-minute basis. Per-game distributions are useful in understanding the possible ceiling and floor of players. Per-minute distributions can be useful in projecting fantasy production of players in elevated roles - e.g. expectation for a season-long reserve elevated to starting lineup due to teammate injury or trades.
Inactive Pivot App
This has been one of our most popular apps over the years, allowing users to easily search the impact of game inactives. Select one or multiple inactive players to view marginal differences in usage, minutes, fantasy points, and fantasy-points-per-minute. For games with multiple noteworthy inactives you can view relative difference in player metrics for games when either all of the selected players are inactive or when any of the selected players are inactive.
Raw Data Download
Lastly, you can download all of the raw data that we use to produce these tools, if you are interested in working with the data yourself to develop custom NBA DFS tools, projections, and more.
ASA Projections via FantasyLabs Marketplace
FantasyLabs subscribers can access ASA projections through the FantasyLabs marketplace. By purchasing an ASA projection add-on, users can leverage the FantasyLabs optimizer with ASA projections pre-loaded into the optimizer, or can add ASA projections to a weighted projection set with FantasyLabs base projections and other third-party projection providers.
ASA Projections via One Week Season
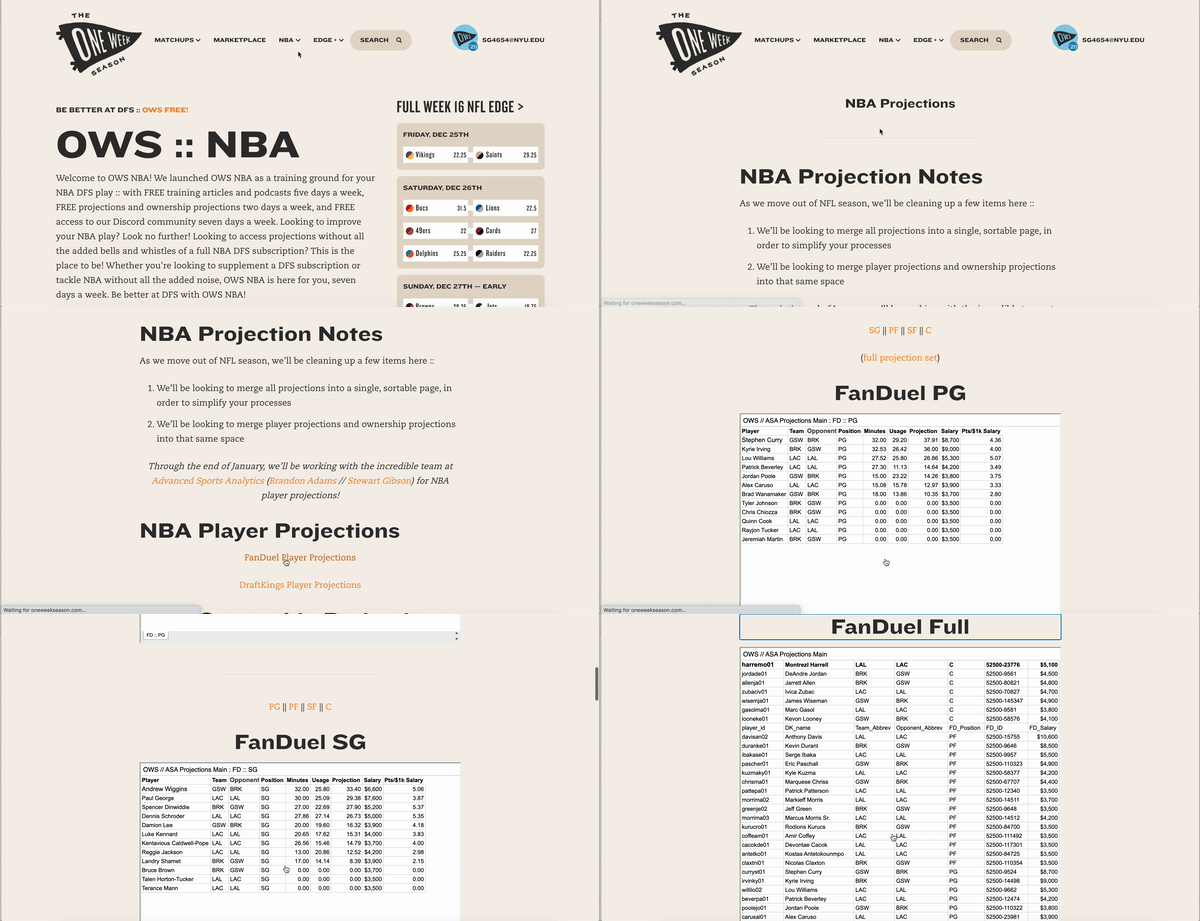
ASA projections will be available to OWS subscribers, along with OWS’ ownership projections. You can leverage these projections for hand-building lineups, they will be free to access on Sunday & Monday, behind the OWS paywall all other days. OWS also offers free and premium written and audio content to help with your NBA DFS strategy considerations.
2021 NBA Development Pipeline
We intend to have some of our 2020 tools back for the 2021 season. Specifically, our Blowout Boost App, Opponent vs. Position App, and our Heat Check App. We hope to have those up and running soon, our database infrastructure has shifted a bit since last year and as such we need to make some updates to make these applications functional.
We want to build out more NBA tools that emulate some of our most popular NFL tools. There are two tools of particularly high priority.
A “Volume/Efficiency” tool that is similar to our NFL Volume x Efficiency app. This tool is extremely useful for viewing player opportunity (volume) and per-minute or per-possession efficiency metrics over time. We would also like to incorporate some components of the Inactive Pivot app, where you can view metrics over time, filtering on date range or filtering on specific inactive players. This tool is extremely useful to us as we set our projections on a daily basis.
A “Player Correlation” tool. We had a player correlation tool available last NBA season, but it was exceptionally slow in calculating player correlation, on account of a) increased number of instances (games) and b) increased number of possible player combinations.
We hope to fully build out this toolkit soon.
If you have any questions about the current set of NBA tools, our 2021 development roadmap, or any of our NBA content partners, don’t hesitate to reach out to us via email (advsportsanalytics@yahoo.com) or Twitter (@ASAnalyticsDFS).


